|
Joint Economic Committee Democrats
Pension Charts
Chart 1.2
Last updated 7/25/06
Download this chart in PDF
-
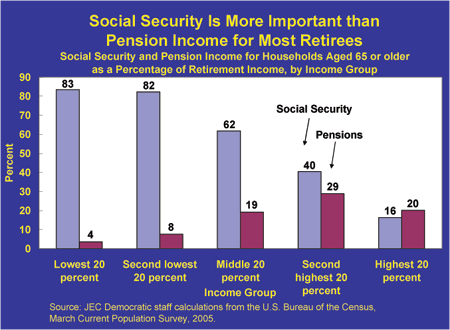
Overall, pensions accounted for about one-fifth of household income for retirement-age households in 2004, although that percentage varied considerably by income group.
-
For all but the highest-income group, Social Security benefits were more important than pension income.
-
Among lower-income groups, Social Security benefits accounted for over 80 percent of total income. In contrast, pension income accounted for less than 10 percent of total income for these households.
-
Pension benefits as a percentage of total income were greatest for the second highest 20 percent of households (those with incomes between $24,000 and $40,200). But even for these households Social Security benefits were far more important.
Note: Households aged 65 or older include unmarried individuals and married couples in which at least one spouse is 65 or older. Pensions include private pensions and annuities, government employee pensions, regular payments from an IRA, Keogh, or 401(k) plan, and Railroad Retirement benefits. In 2004, the lowest 20 percent of households had income below $10,900, the second lowest 20 percent had income between $10,900 and $16,400, the middle 20 percent had income between $16,400 and $24,000, the second highest 20 percent had income between $24,000 and $40,200, and the top 20 percent had income above $40,200.
|